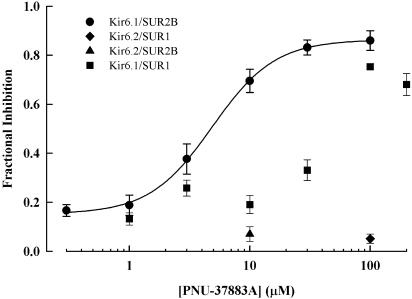
Figure 2.
Concentration–response relationship for PNU-37883A inhibition of Kir6.1/SUR2B. Inhibition is expressed as a fraction of the 10 μM glibenclamide-sensitive current at −60 mV. The curve was fitted to the data with the Hill equation with a slope factor of 1.67 and an IC50 of 4.88 μM. Data for Kir6.1/SUR1, Kir6.2/SUR2B and Kir6.2/SUR1 are also shown. All data are mean±s.e.m., n=2–13.

