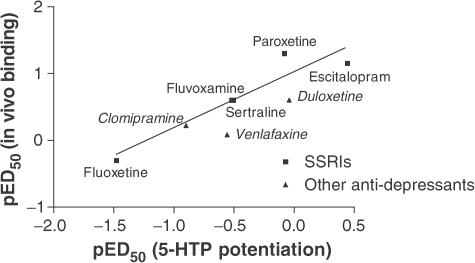
Figure 6.
Correlation between in vivo binding pED50 and pED50 obtained from behavioural 5-HTP experiments. The slope of the graph was 0.82 and r2=0.86, indicating a good correlation between the in vivo binding and the 5-HTP behavioural model of SERT activation. The correlation was based only on the data from the SSRIs, but duloxetine, venlafaxine, and clomipramine were included on the graph to illustrate that they follow the same trend as the SSRIs.

