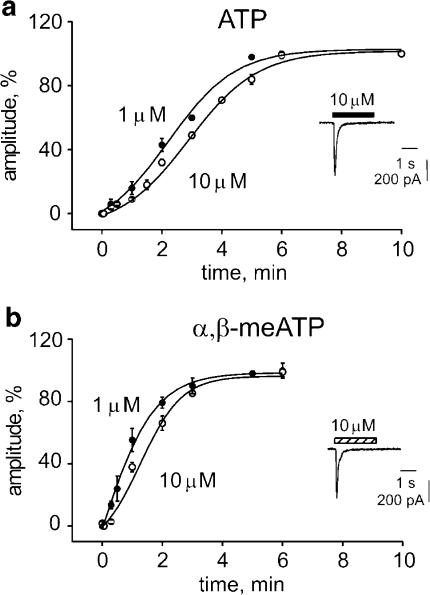
Figure 1.
Sigmoidal time course of recovery from desensitization of P2X3 receptors of DRG neurons. (a) Responses are elicited by 2 s application of 1 (filled circles) or 10 (open circles) μM application of ATP (see inset for representative inward current induced by 10 μM ATP). Recovery is plotted as % peak amplitude of control response. Data points are from 5 to 15 cells; error bars are omitted when smaller than symbols. Curves are fitted as described in the Methods. (b) Recovery plots for responses induced by 1 or 10 μM α,β-meATP. Data points are from 5 to 6 cells. For further details see (a).

