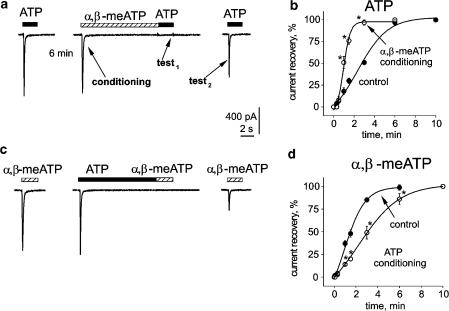
Figure 3.
Agonist-dependent modulation of P2X3 receptor desensitization of DRG neurons. (a) Protocol to study interaction between agonists during the process of recovery from desensitization. In particular, after a response to ATP (10 μM) that peaked and fully desensitized, 6 min rest was allowed for full recovery and 10 μM α,β-meATP was applied for 10 s (conditioning) to produce a peak current that fully decayed to baseline. After α,β-meATP washout, the subsequent ATP application (test1) elicited no response. In this example, after a 1.5 min interval, the next ATP application (test2) produced a much larger current than in the standard recovery protocol. (b) plots of desensitization recovery. Time is either the interval between ATP applications (10 μM) in control conditions (filled circles), or the time interval between test1 and test2 ATP responses after 10 μM α,β-meATP conditioning (open circles). n=3–6 cells, statistically significant differences (P<0.05) are indicated with asterisks. Note strong acceleration of recovery after α,β-meATP conditioning. (c) Protocol similar to the one shown in (a) (same cell) to explore 10 μM ATP conditioning effect on responses evoked by 10 μM α,β-meATP. ATP conditioning largely delayed recovery from desensitization. (d) Plots of recovery of α,β-meATP responses in control conditions or after 10 μM ATP conditioning. For further details see (b) Note that recovery becomes significantly slower after ATP conditioning (n=4–6; *P<0.05).

