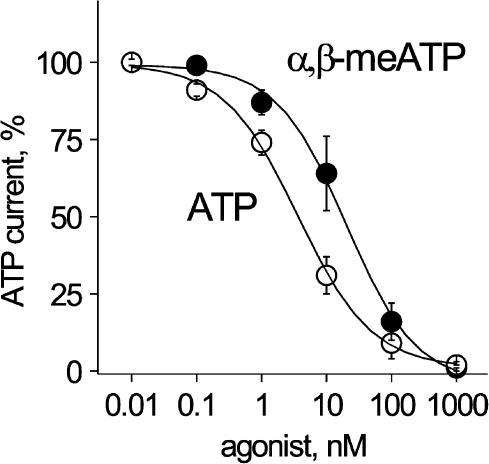
Figure 5.
Bath-applied, low agonist concentrations strongly depress responses of DRG neurons to ATP. Plot of % amplitude of response induced by 10 μM ATP versus conditioning agonist log concentration always applied for 1.5 min. Note that ATP (open circles) is more powerful than α,β-meATP (filled circles) to inhibit ATP response. Data are from 4 to 6 cells.

