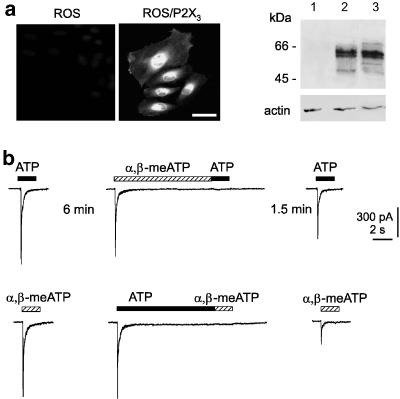
Figure 8.
P2X3 receptors expressed by ROS cells show same interaction between ATP and α,β-meATP responses as observed with native DRG receptors. (a) Immunofluorescence-based detection of P2X3 receptor expression using an anti-P2X3 antibody. Transfected cells are immunopositive (middle panel), while untransfected cells are not stained (left). Calibration bar=50 μM. Right, Western immunoblot analysis of transfected ROS cells demonstrates bands from 55 to 60 kDa in accordance with previous results (Nicke et al., 1998; Vulchanova et al., 1998). Transfected ROS cell extracts (lane 2) are comparable with the pattern obtained from rat DRG tissue lysates (lane 3), while untransfected ROS cell extracts give negative result (lane 1). (b) Top records: on transfected ROS cell, 10 μM α,β-meATP (10 s) generates an inward current that fully decays to baseline and suppresses subsequent response to 10 μM ATP. Response to ATP evoked 1.5 min later has, however, regained larger amplitude. Bottom records: 10 μM ATP (10 s) induces an inward current that fully desensitizes and prevents subsequent response to α,β-meATP (10 μM). After a 1.5 min interval, current evoked by α,β-meATP remains substantially depressed. All traces are from the same cell. Note that effects recorded from ROS cell are the same as observed on DRG neurons (Figure 3).

