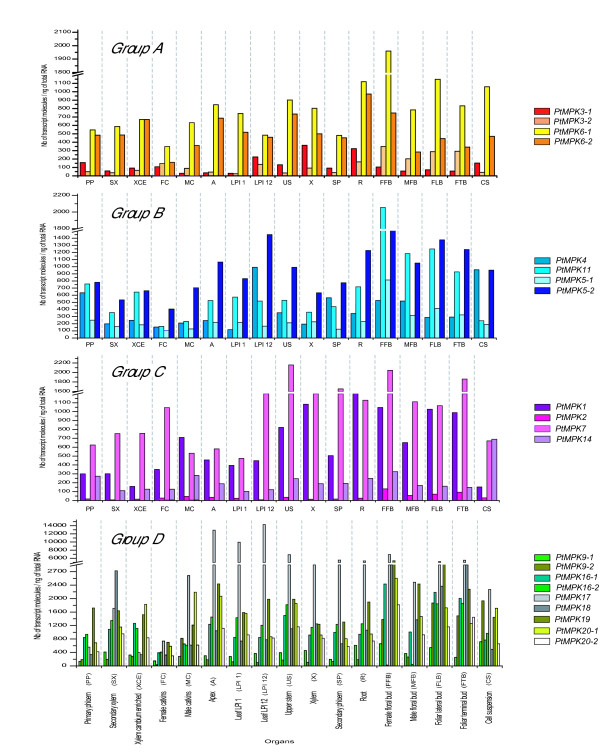
Figure 9.

Steady-state transcript accumulation for all members of the four phylogenetic groups of PtMPK genes. After determination of RTqPCR primers efficiency and generation of standard curves, RTqPCR analysis was performed for each poplar MAPK gene. Twelve nanograms of cDNA were used in each RTqPCR reaction. Results are expressed in number of specific transcripts per ng of total RNA. Values represent the mean of six independent reactions (two repeats for each of three independent samples). Cts were determined using single fluorescent readings that were taken after each cycle.
