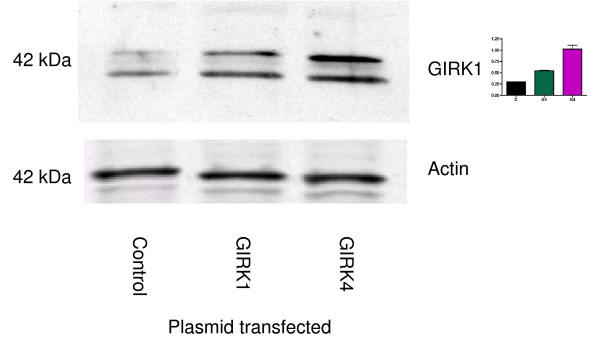
Figure 5.
Western blot indicates an increased GIRK1 protein expression in MDA-MB-453 breast cancer cells 48 hours after transfection with plasmids containing GIRK1 or GIRK4. Top panel: GIRK1 expression; these bands are at the lower MW (40–42 kDa) indicated in Figure 1. Bottom panel: Membranes were additionally probed with an antibody for actin to ensure equal loading of protein between samples. Graph indicates densitometry of bands, and data are shown as a ratio of GIRK/actin.

