Figure 3.
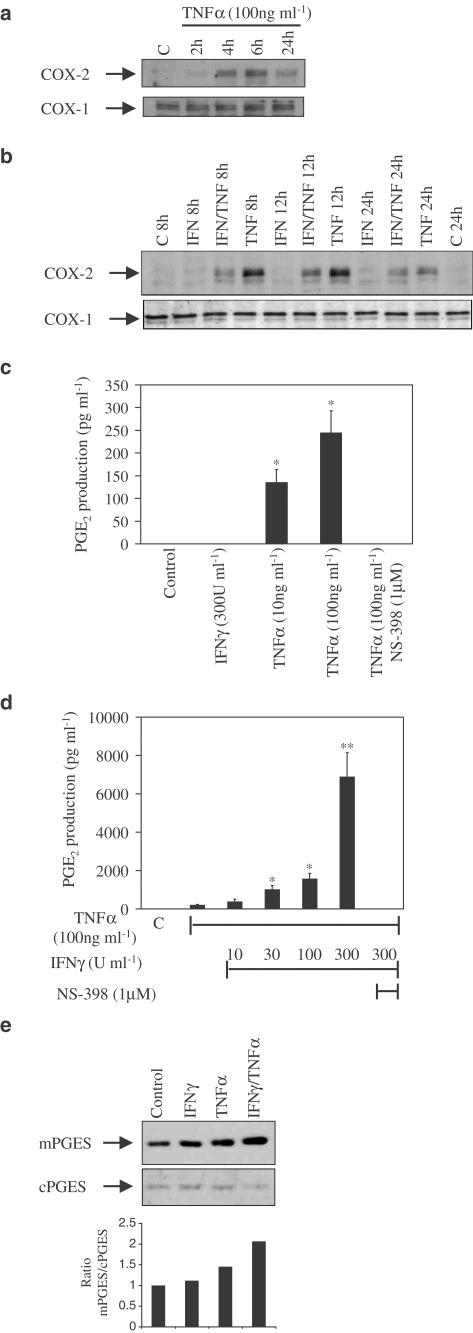
Cytokine regulation of COX-2 protein and activity. (a) Western analyses of protein isolated from HT-29 cells stimulated with TNFα (100 ng ml−1) over a 24 h time course and probed with specific antibodies for COX-2 (upper panel) and COX-1 (lower panel). (b) Western analysis of protein isolated from HT-29 cells exposed for up to 24 h to either TNFα (100 ng ml−1) or IFNγ (300 U ml−1) alone and in combination. Lane C represents an unstimulated control sample. Blots are from single experiments, but are representative of at least three others. (c) An ELISA for PGE2 (pg ml−1) using supernatants from HT-29 cells stimulated with either TNFα (10 and 100 ng ml−1) alone for 24 h or (d) in the presence of increasing concentrations of IFNγ (10–300 U ml−1) and then the addition of the specific COX-2 inhibitor NS-398. Lane C represents an unstimulated control sample. Data are the mean±s.e.m. of three separate experiments. *P⩽0.05; **P⩽0.001. (e) Cytokine induction of mPGES. Western analysis of HT-29 cells exposed to cytokine alone (concentrations as previous experiments) or in combination for 24 h (as indicated). Membranes were probed for mPGES and cPGES. Lane C represents an unstimulated control sample. Blots are representative of three separate experiments.

