Figure 3.
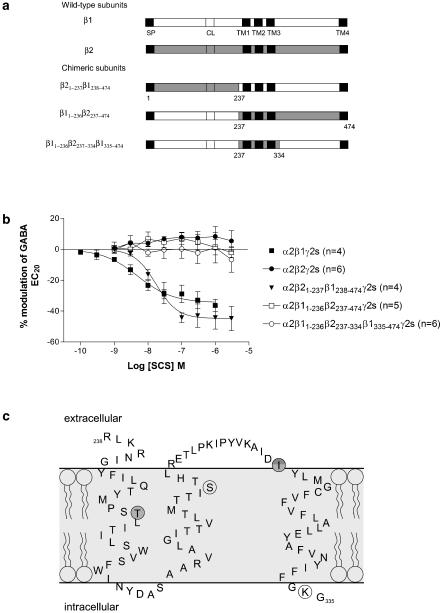
Effect of SCS on the β1/β2 chimeras. (a) Diagrammatic illustration of the β1/β2 chimeras. β1 sequence is represented by clear boxes and β2 sequence by shaded boxes. SP=signal peptide, CL=cysteine link, TM=transmembrane. (b) Concentration–response curves to SCS on Xenopus oocytes expressing α2β1γ2s, α2β2γ2s, α2β21–237β1238–474γ2s, α2β11–236β2237–474γ2s and α2β11–236β2237–334β1335–474γ2s receptors. Data are normalized to the control GABA EC20 response immediately prior to construction of the concentration–response curve. Data are mean±s.e.m. with the number of cells in each group indicated in brackets. Inhibition by SCS is abolished when a small region encompassing TM1, TM2 and TM3 is replaced in β1 with the corresponding β2 sequence. (c) Schematic diagram illustrating the critical region responsible for SCS inhibition within the human β1 subunit as identified from the β1/2 chimeras. The TM regions are illustrated within the light grey area, and are in agreement with those proposed by Korpi et al. (2002). The four amino-acid residues that are different between β1 and β2/3 are circled. The darker two circles correspond to threonine 255 and isoleucine 308, the two residues critical for inhibition by SCS.

