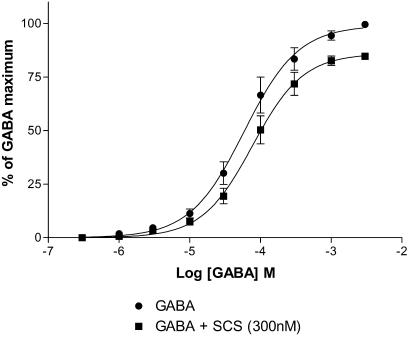
Figure 5.
Concentration–response curve to GABA in the absence and presence of SCS on Xenopus oocytes expressing α2β2γ2s receptors. Both concentration–response curves (absence and presence of SCS) were performed in one oocyte and replicated four times. Data were normalized to the current obtained with 3 mM GABA in the absence of SCS. The GABA pEC50 and Hill coefficient values were not significantly different (−4.2 vs −4.1 M and 1.1 vs 1.2, respectively), whereas the maximum response was significantly reduced in the presence of SCS (99.1 vs 85.9%, P=0.002). Data are mean±s.e.m.

