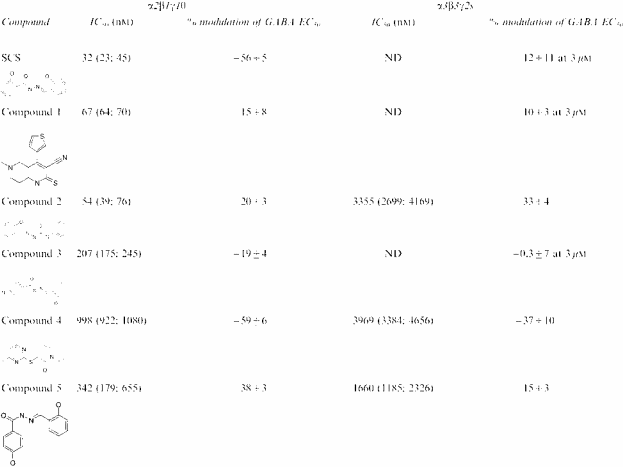
Table 1.
IC50 and maximum inhibition values for SCS and a range of structurally related compounds using FRET techniques and VIPR measurements at α2β1γ1θ and α3β3γ2s GABAA receptors expressed in Ltk− cells
|
Data represent modulation of the response to an EC50 concentration of GABA, previously determined for each receptor subunit combination. Data for the IC50 values are presented as the geometric mean (−s.e.m.,+s.e.m.) and the maximum inhibition as the arithmetric mean±s.e.m. of three to eight determinations. ND=not determined.

