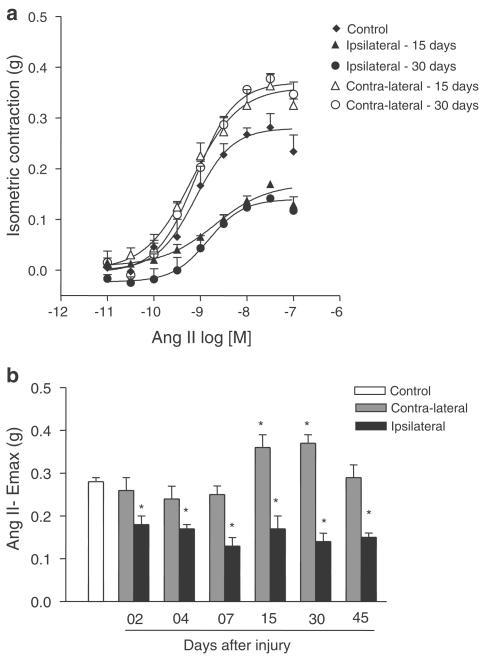
Figure 2.
(a) Ang II concentration–effect curves from control carotid arteries and contralateral and ipsilateral carotid arteries taken 15 and 30 days after the injury; (b) Ang II Emax values (g) from control, contralateral and ipsilateral arteries (2, 4, 7, 15, 30 and 45 days after the injury). One-way ANOVA followed by Bonferroni's post test, P<0.05, *significantly different from control group.

