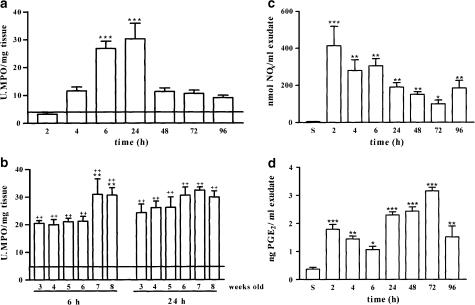
Figure 2.
MPO activity and NOx and PGE2 levels measured in paw homogenates from saline- and carrageenan-injected paws of CD1 8-week-old mice. Panel (a) shows the time dependence of MPO activity in 8-week-old CD1 mice that peaks at 6 h and remains elevated up to 24 h. The solid line represents basal MPO activity detected in saline-injected paws from the different groups studied (4.74±0.45 U MPO mg−1 wet tissue). Panel (b) shows MPO values at 6 and 24 h in 3–8-week-old CD1 mice. Panels (c) and (d) show the time dependence of NOx and PGE2 production, respectively, in response to both saline (S) and carrageenan injection. For panels (a) and (b), values are mean±s.e.m. (n=6–10). **P< 0.01, in comparison to the 3-week-old mice; ++P<0.01 in comparison to the basal levels (solid line). For panels (c) and (d), values are mean±s.e.m. (n=6–10). ***P<0.001, **P< 0.01, *P<0.05 in comparison to the saline-injected group.

