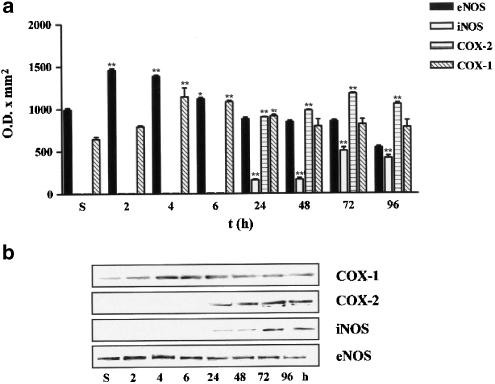
Figure 6.
Time course of eNOS, iNOS, COX-1 and COX-2 expression and densitometric analysis of saline-injected and carrageenan-injected paws of C57BL/6J mice 8-week old. The figures are representative of three similar experiments. Values are mean±s.e.m. (n=3). ***P<0.001, **P<0.01, *P<0.05 in comparison to the saline group.

