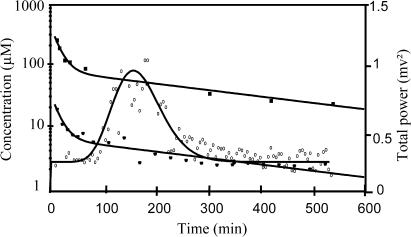
Figure 3.
Total concentrations of norfloxacin in plasma, unbound concentrations of norfloxacin in brain and EEG effect versus time for a representative rat. The broken line represents the best PK fit to the measured concentrations of norfloxacin in plasma, with the following values for PK parameters: A=272 μM (96.7 mg l−1), B=109 μM (38.7 mg l−1), α=0.119 min−1 and β=0.00351 min−1. The solid line represents the best fit to the measured total power of the EEG signal effect, according to the effect compartment model, with the following values for PD parameters: P0=0.25 mV2, B=0.0158 mV2 μM−1, n=17.7, ke0=0.008 min−1.

