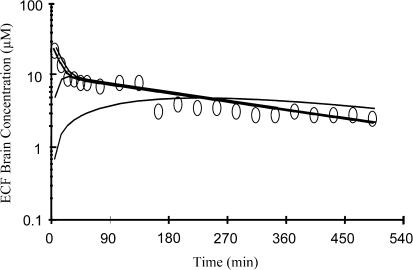
Figure 4.
Simulation of brain concentrations (solid lines) using the model M1a (Figure 1) with different values of CLout,b from 8.3 × 10⁻⁶ (1) (CSF bulk flow value=2.5 μl min−1) to 8.3.10−3 (2) l min−1 kg−1 of body weight and using the previously estimated parameter values of a representative rat: V1=1.192 l kg−1, V2=2.264 l kg−1, Vb=0.00195 l kg−1, R=0.094, k12=0.074 min−1, k21=0.0364 min−1, k10=0.0093 min−1, for a dose equal to 150 mg kg−1. The observed ECF brain concentrations are represented by round (0) for the same representative rat.

