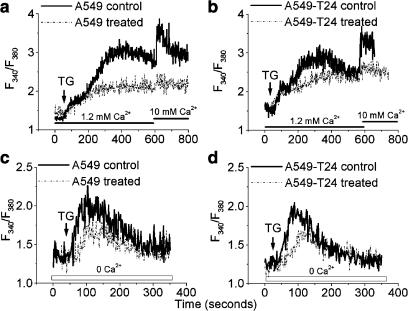
Figure 11.
TG-evoked Ca2+ response in Taxol-treated cells. The tumor cells were treated with either vehicle (control, solid line) or IC50 concentrations of Taxol (treated, dotted line) for 24 h. [Ca2+]c in Fura-2-AM-loaded cells were then measured as described in Methods. (a, b) A representative tracing of the response of [Ca2+]i of A549 (a) and A549-T24 (b) cells in response to TG (100 nM) in the presence of 1.2 mM of calcium, followed by addition of extracellular calcium (10 mM). (c, d) A representative tracing of the response of [Ca2+]i of A549 (c) and A549-T24 (d) cells in response to TG (100 nM) in the absence of extracellular calcium.

