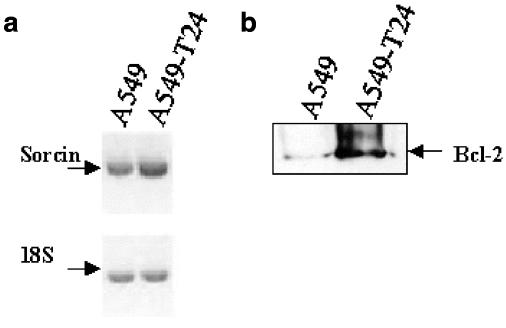
Figure 9.
Expression of sorcin and Bcl-2 in A549 and A549-T24 cells. Semi-quantitative RT–PCR analysis of sorcin mRNA expression (a), and Western blot analysis of Bcl-2 (22 kDa) protein expression (b) were carried out as described in Methods. The intensities of the bands were measured by densitometry. The expression of 18S ribosomal RNA was used as an internal control. A549-T24 cells expressed significantly higher levels of sorcin mRNA (P<0.05, N=3), and Bcl-2 protein (P<0.01, N=3).

