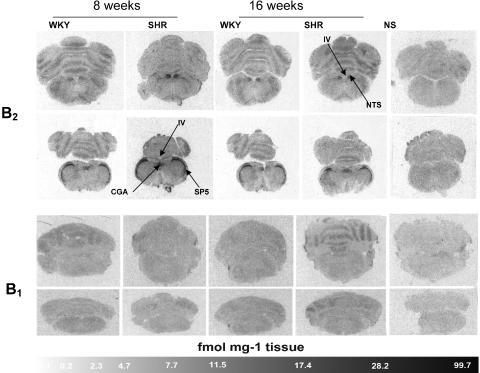
Figure 6.
Autoradiographic distribution of kinin B1 and B2 receptors in the brain of 8- and 16-week-old WKY and SHR. Shown are autoradiograms representing total binding of [125I]HPP-desArg10-Hoe 140 (B1 receptor ligand) or [125I]HPP-Hoe 140 (B2 receptor ligand). Nonspecific (NS) binding in the presence of 1 μM of HPP-Hoe 140 (B2 receptors) and HPP-[des-Arg10]-Hoe 140 (B1 receptors) are also shown. Pictures are presented as obtained with the image analysis system. CGA, central gray (alpha part); SP5, spinal trigeminal tract; NTS, nucleus tractus solitarius; IV, fourth ventricle.

