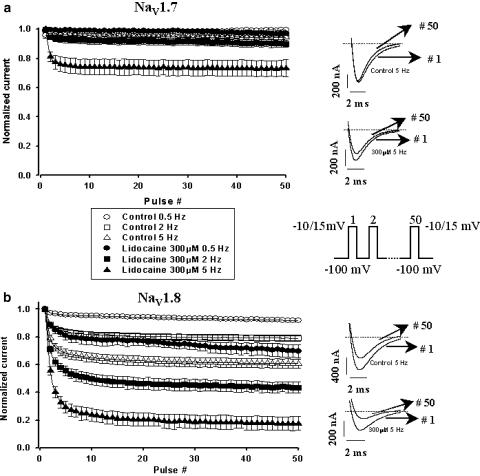
Figure 5.
Frequency-dependent inhibition of Nav1.7 (a) and Nav1.8 (b) Na+ currents in the presence and absence of lidocaine 300 μM. Oocytes were held at −100 mV and a train of fifty 8 ms pulses was applied to −10 mV (Nav1.7) or +15 mV (Nav1.8) at three different frequencies (0.5, 2 and 5 Hz), with the interpulse potential also set at −100 mV. The peak currents elicited by each pulse were normalized to the current of the first pulse (Pn−P1, where n=1–50) and were then plotted versus pulse number. Different open symbols represent control conditions while filled symbols represent the protocol in the presence of 300 μM lidocaine for the different frequencies (circles represent 0.5 Hz, squares represent 2 Hz and triangles represent 5 Hz). Examples of current traces at the 1st and 50th pulse of the protocol for each channel in the presence and absence of lidocaine are shown in the right panel. The central panel shows a schematic representation of the electrical protocol used.

