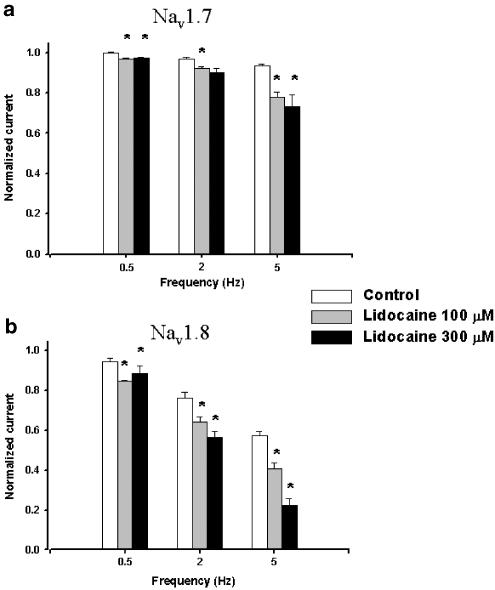
Figure 6.
Bar plot representation of the relative amplitudes at the 50th sweep of the frequency dependence protocol used in Figure 5 for each frequency. The amplitudes of the last step were normalized versus the first step of the protocol. White columns are control currents, gray columns are currents' amplitudes after perfusion with 100 μM lidocaine and black columns are currents' amplitudes in the presence of 300 μM lidocaine. (*=P<0.05).

