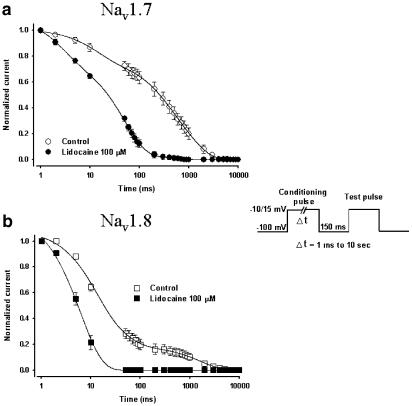
Figure 7.
Development of slow inactivation by both Nav1.7 (a) and Nav1.8 (b) channels with and without lidocaine. Control conditions are open circles (Nav1.7) and open squares (Nav1.8) while experiments with the drug are represented by filled circles and squares. The entry into slow inactivation was measured using a double-pulse protocol consisting of a conditioning pulse of variable duration (1 ms to 10 s) to −10 mV (Nav1.7) or 15 mV (Nav1.8) to inactivate the channels. A 150 ms pulse to −100 mV was then applied to allow rapid recovery and a standard test pulse was used to measure the amount of available channels (see inset). The measured currents were then normalized and plotted against the duration of the conditioning pulse. The decrease in currents was best fitted in all cases with the sum of three exponentials (solid lines). See Table 1 for the time-constant values.

