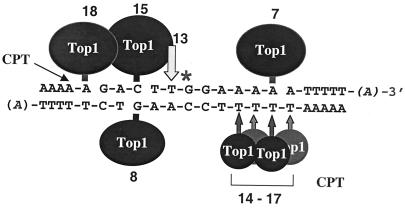
Figure 5.
Summary of the effects of BaP DE-2 dG adducts (position indicated by the asterisk) on top1 cleavage. Top1 cleavage complexes induced by the BaP DE-2 adducts are indicated by filled circles with linkage to the DNA 3′ terminus. The size of the circles is not meant to correlate with the extent of DNA cleavage. Numbers refer to the size of the fragments detected in DNA sequencing gels after DNA 3′-end labeling (see Figs. 2 and 3). Note that the 7-mer derived from the lower strand and shown in Fig. 3 (control) is not represented. Open arrow indicates the major top1 cleavage site in the control oligonucleotide, which is suppressed by the adducts. CPT, camptothecin-induced sites.

