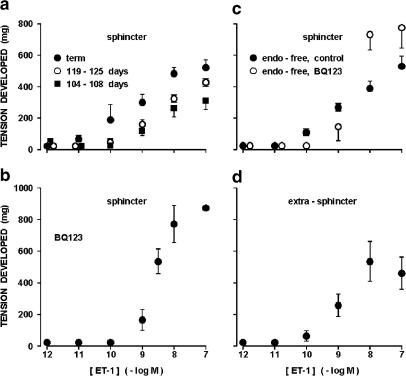
Figure 3.
Concentration–response curve to ET-1 in the ductus venosus from fetal lamb. (a) Intact ductus sphincter at different gestation ages. The ED50 for the contraction is 0.86±0.49 (n=3), 1.84±0.37 (n=5), and 1.9±0.54 nm (n=5), respectively at term, 119–125 days, and 104–108 days. Dose–response curves for the two preterm groups are significantly different (P<0.001) from the curve at term, but do not reach a significant difference among themselves. (b) Intact ductus sphincter at term; contraction during treatment with BQ123 1 μM (n=3–4, except for the 0.1 μM dose where n=2). (c) Endothelium-denuded ductus sphincter at term; contraction before and during the treatment with BQ123 1 μM (n=9 and 3, respectively). (d) Intact ring preparation from the extrasphincter part of term ductus. The ED50 for the contraction is 1.2±0.3 nM (n=3).

