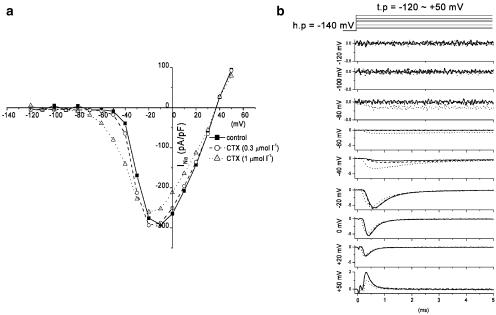
Figure 2.
Effects of external application of CTX3C on rNav1.2. (a) I–V curves in the absence (closed squares) and presence of CTX3C at a concentration of 0.3 μmol l−1 (open circles) and 1.0 μmol l−1 (open triangles). Note the hyperpolarizing shift of the I–V curve produced by 1.0 μmol l−1 CTX3C. (b) Current records at nine different test potentials (−120 to + 50 mV). The top panel indicates the command potential (holding potential set to −140 mV). Superimposed current records at each potential correspond to control (no drug; solid line), 0.3 μmol l−1 CTX3C (broken line), and 1.0 μmol l−1 CTX3C (dotted line).

