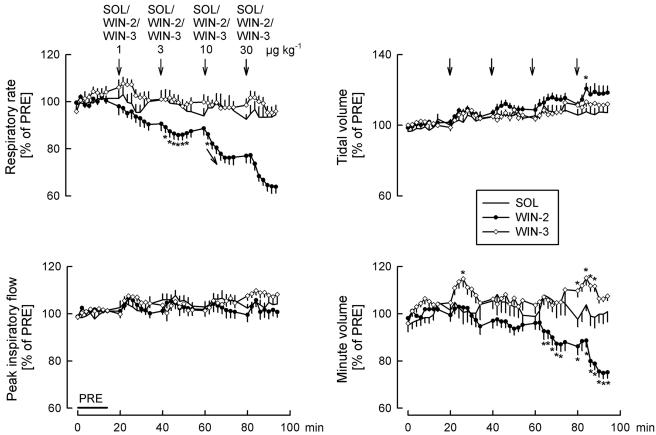
Figure 3.
Effects of solvent (SOL), WIN55212-2 (WIN-2) and WIN55212-3 (WIN-3) on respiratory rate, peak inspiratory flow, tidal volume and minute volume. SOL (25 μl kg−1), WIN-2 (1, 3, 10 and 30 μg kg−1) and WIN-3 (1, 3, 10 and 30 μg kg−1) were injected i.c. as indicated by the arrows. Values are given as percentages of PRE. Means±s.e.m. from eight (SOL), eight (WIN-2) and eight (WIN-3) experiments. *P<0.05 versus SOL (arrows in the graphs indicate that all further values were significantly different from SOL).

