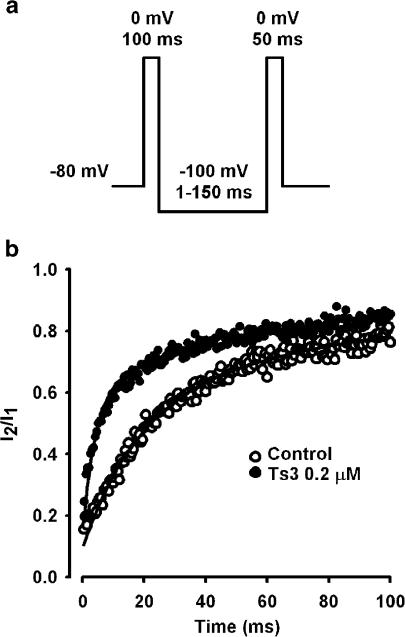
Figure 3.
Effect of Ts3 on recovery from inactivation. (a) Pulse protocol used to measure the recovery from inactivation. (b) Comparison of the recovery before (n=6) and after Ts3 treatment (n=7). The fraction of current recovered was plotted as a function of the time between the two pulses applied. Continuous curves show the best fit obtained for each set of data with the function: I2/I1=1−[a exp(−t/τf)+b exp(−t/τs)], where a and b are the amplitudes of the fast and slow components of the recovery, respectively, τf is the fast time constant and τs is the slow time constant. The parameters obtained were: a=0.6±0.03 and 0.6±0.01; b=0.4±0.03 and 0.4±0.01; τf=12.4±0.9 and 3.1±0.4; τs=143.1±29.3 and 85.9±10.0, for control (n=11) and experimental (n=11), respectively. These experiments were carried out at 15°C.

