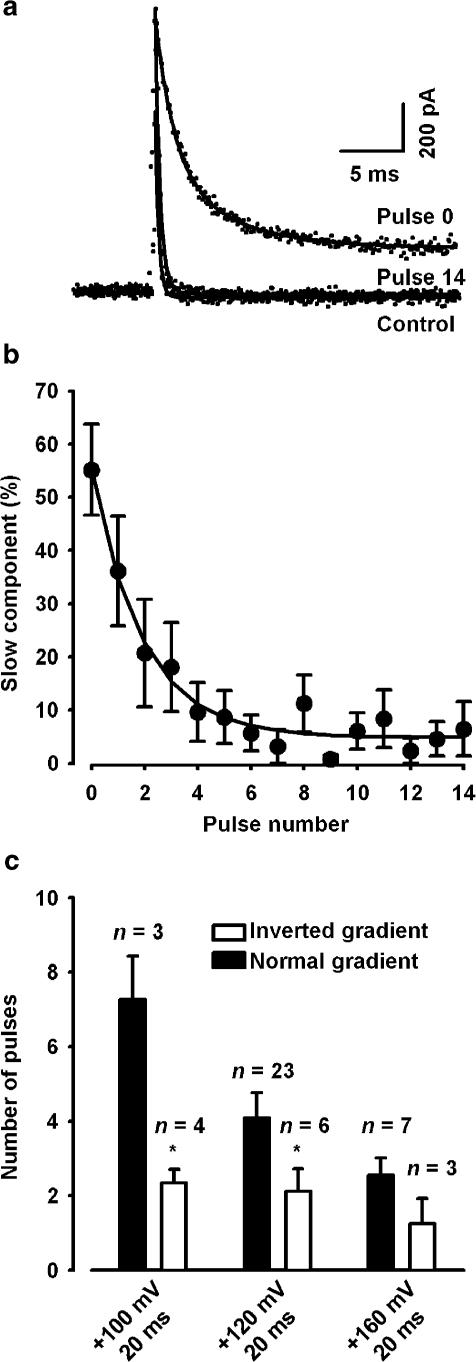
Figure 5.
Effect of depolarising pulses on Ts3 displacement with inverted Na+ gradient. (a) Outward Na+ currents (dotted lines) in control condition superimposed with two records obtained from a cell pre-treated with saturating concentration of Ts3, before (pulse 0) and after (pulse 14) been subjected to the protocol shown in Figure 4a (depolarising pulse to +120 mV). Superimposed continuous lines show the best fit to the decay of the currents. Control currents and current generated by pulse 14 were best fitted with single exponential, whereas double exponential was needed after treating with Ts3. (b) Effect of consecutive depolarising pulses to +120 mV on the contribution of the slow component. The exponential curve gives the number of pulses needed for an e-fold displacement of Ts3. (c) Comparison of the number of pulses needed for an e-fold displacement of Ts3 in normal and inverted gradient. *, significantly different from normal gradient at each potential.

