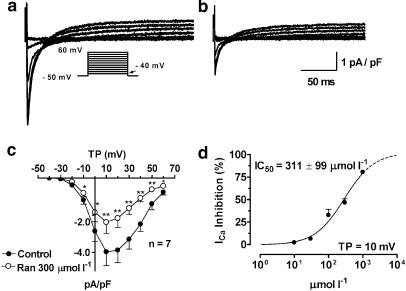
Figure 6.
ICa inhibition by ranolazine. (a, b) ICa current recordings before (a) and after application of 300 μmol l−1 ranolazine (b). Currents were elicited from a holding potential of −50 mV to test potentials between −40 mV (arrow) and +60 mV as shown by the protocol in the inset. (c) Mean current–voltage relationships under control conditions (filled circles) and in the presence of 300 μmol l−1 ranolazine (open circles). (d) Mean concentration–response curve at a test potential of 10 mV. Results are mean±s.e.m. *P<0.05 and **P<0.01 vs control, n=8.

