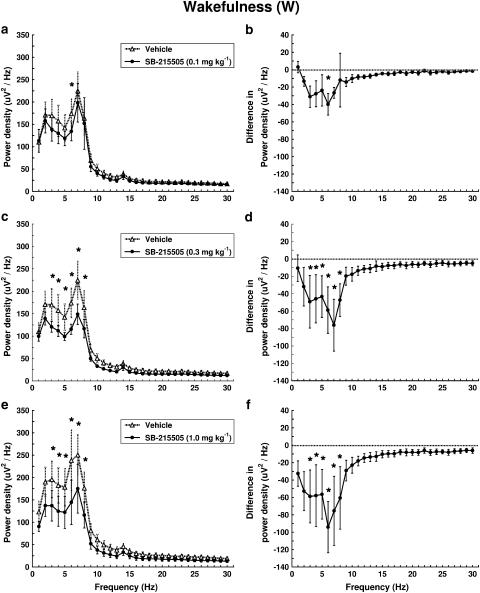
Figure 3.
Dose–response effect of SB-215505 on EEG power spectra in W in conscious, freely moving rats in the first hour after treatment. Each point represents mean values (±s.e.m.) of 1 Hz bins in a 1 h recording period. The curves connect absolute power density values after vehicle and drug treatment (a, c, e) or the differences in drug treatment compared to vehicle treatment (dashed line) (b, d, f). *Significant effect of SB-215505 compared to vehicle, P<0.05. (a, b) 0.1 mg kg−1 i.p. (n=5); (c, d) 0.3 mg kg–1 i.p. (n=5); (e, f) 1.0 mg kg−1 i.p. (n=5).

