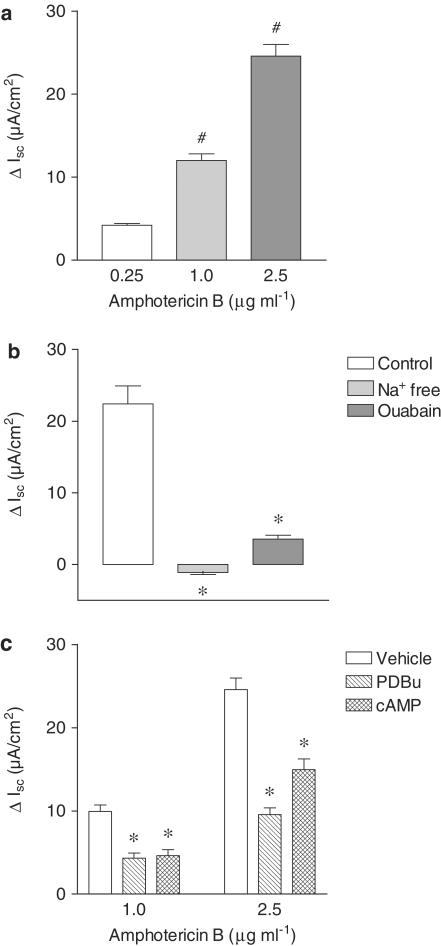
Figure 7.
(a) Effect of increasing concentrations of amphotericin B (0.25–2.5 μg ml−1) applied from the apical cell border upon short-circuit current (ΔIsc, μA cm−2) in Caco-2 cells. (b) Effect of removal of Na+ from the solution bathing the apical cell side and ouabain (500 μM) upon changes in short-circuit current (ΔIsc, μA cm−2) induced by amphotericin B (1.0 μg ml−1) applied from the apical cell side. (c) Effect of cAMP (0.5 mM) and PDBu (1 μM) upon changes in short-circuit current (ΔIsc, μA cm2) induced by amphotericin B (1.0 and 2.5 μg ml−1) applied from the apical cell side. Columns represent the mean of three to nine experiments per group and vertical lines show s.e.m. Significantly different from values for 0.25 μg ml−1 amphotericin B (#P<0.05) or corresponding control values (*P<0.05) using the Newman–Keuls test.

