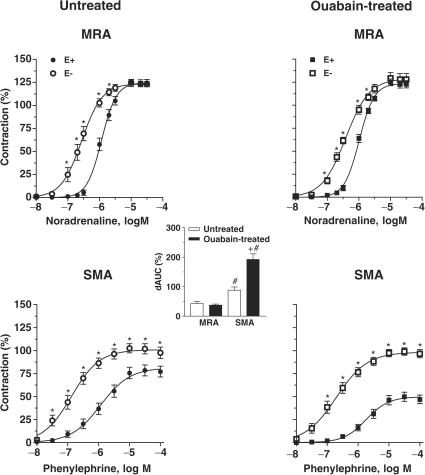
Figure 3.
Effect of endothelium denudation on the concentration-dependent response curves to noradrenaline and phenylephrine in MRA and SMA, respectively, from ouabain-treated (N=7–9) and untreated (N=7–9) rats. Results (means±s.e.m.) are expressed as a percentage of response elicited by KCl. ANOVA (two-way): *P<0.05. The inset graph shows the dAUC to noradrenaline or phenylephrine in endothelium-intact (E+) and -denuded (E−) arteries. dAUC values (means±s.e.m.) are expressed as a percentage of the difference of the corresponding AUC for segments with intact endothelium (unpaired t-test, #P<0.05, SMA vs MRA; +P<0.05 ouabain-treated vs untreated rats).

