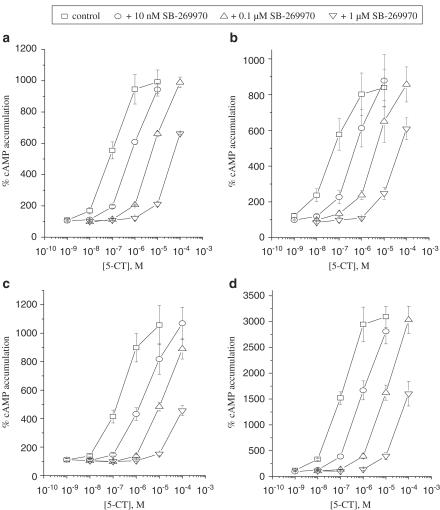
Figure 2.
Concentration–response curves of 5-CT in the absence (control) and in the presence of 10 nM, 0.1 and 1 μM SB-269970 in (a) U-373 MG, (b) DBTRG-05MG, (c) T98G and (d) H4 cells. Data are mean values±s.e.m. from three or four individual experiments. Results are expressed as percentage of basal cAMP accumulation.

