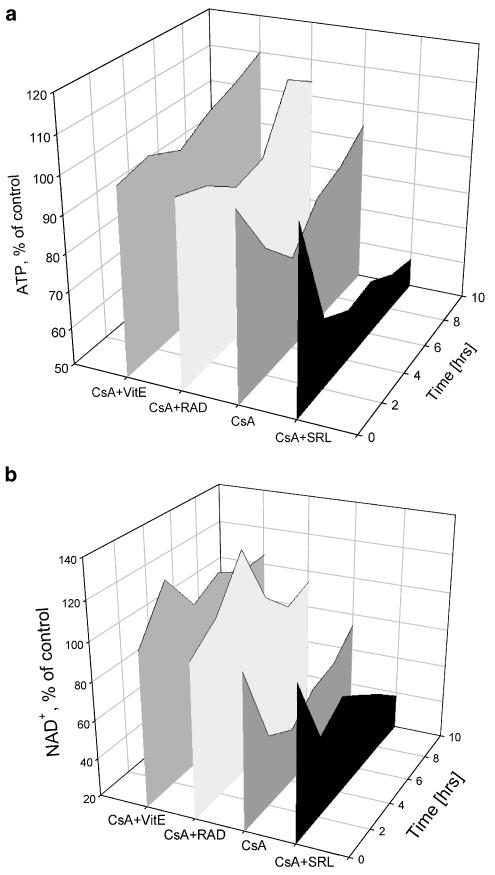
Figure 2.
Time dependency of the metabolic effects of cyclosporine alone and in combination with sirolimus, everolimus, and vitamin E on (a) ATP and (b) NAD+ concentrations in perfused rat brain slices calculated from ex vivo 31P-MRS. To facilitate visual comparison, standard deviations are not shown. Data and standard deviations are listed in greater detail in Table 1. CsA, cyclosporine; NAD+, nicotinamide adenine dinucleotide; RAD, everolimus; SRL, sirolimus; VitE, tocopherol.

