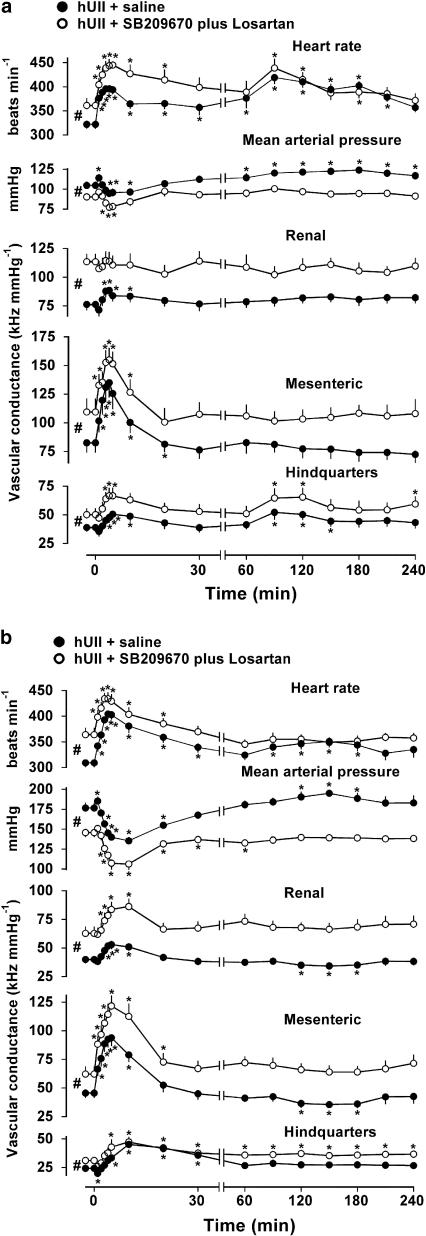
Figure 3.
Cardiovascular variables before and after administration (at time 0) of human urotensin II (hUII; 3 nmol kg−1) in conscious SD rats (a; n=8) and spontaneously hypertensive rats (b; n=8) in the presence of saline (closed circles) or SB 209670 plus losartan (600 μg kg−1, 600 mg kg−1 h−1 and 10 mg kg−1, respectively, open circles). Values are mean and vertical bars show s.e.m. *P⩽0.05 vs baseline (Friedman's test). #P⩽0.05 between baseline values (Wilcoxon's test). Note the change in time scale between 30 and 60 min.

