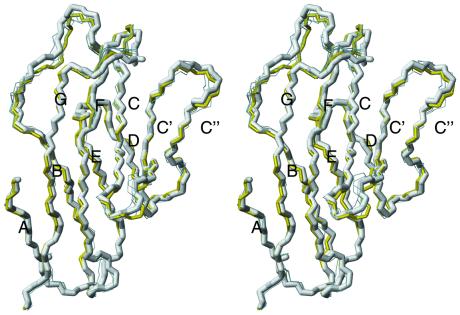
Figure 1.
Stereo diagram of the dominant substates of the adhesion domain of hCD2 in solution. The six most populated substates are shown. The relative population of each substate is indicated with the thickness of the lines. Substates 1 and 2 are colored white and yellow, respectively, the others are colored light blue. The instantaneous structures closest to the average structures of each substate are drawn. The β-strands are labeled A–G. The figure was prepared with the program molmol (27).

