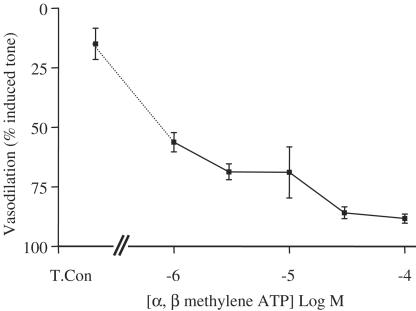
Figure 3.
Concentration–response curve illustrating the vasodilator effects of α, β methylene ATP. Isolated mesenteric vessels were contracted with methoxamine. The data shown are the mean±the s.e.m. for n=3–4 experiments. In these experiments, a single concentration was administered to each tissue, cumulative response curves were not possible because of desensitisation of the drug.

