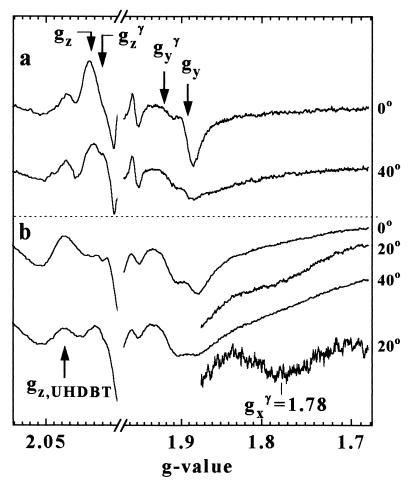
Figure 4.
EPR spectra recorded on oriented samples prepared in the absence of inhibitor (a) and presence of UHDBT (b) at angles between magnetic field and plane of the membrane as indicated. The bottom trace in b represents a difference between spectra recorded after and before γ-irradiation. This latter trace is expanded 4-fold as compared with the other spectra in b. Instrument settings were as described in Fig. 1 apart from a modulation amplitude of 1.6 mT. Note the differing field increments before and after the axis break, yielding a better spectral resolution of the field region of the gz-lines.

