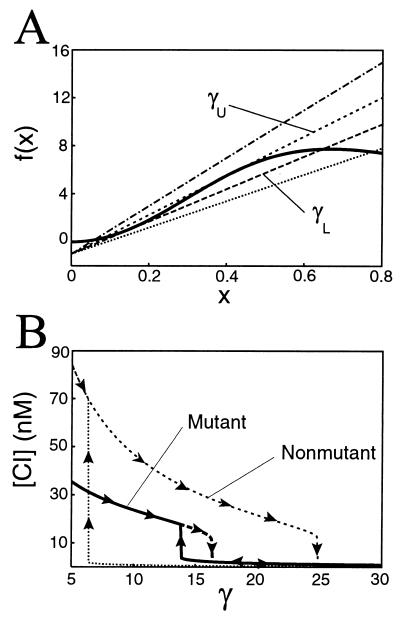
Figure 1.
Bifurcation plots for the variable x and concentration of λ repressor. (A) Graphical depiction of the fixed points of Eq. 7, generated by setting ẋ = 0 and plotting α x2/(1 + 2x2 + 5x4) and the line γx − 1. As the slope γ is increased, the system traverses a region of multistability and returns to a state of monostability. (B) Hysterisis loops for the mutant and nonmutant systems obtained by setting ẋ = 0 in Eqs. 7 and 8. Beginning with concentrations of 35 nM for the mutant system and 85 nM for the nonmutant system, we steadily increase the degradation parameter γ. In both systems, the concentration of repressor slowly decreases until a bifurcation point. In the mutant (nonmutant) system, the repressor concentration abruptly drops to a lower value at γ ∼ 16 (γ ∼ 24). Then, on reversing course and decreasing γ, the repressor concentration increases slowly until γ encounters a second bifurcation point at γ ∼ 14 (γ ∼ 6), whereby the concentration immediately jumps to a value of 15 nM (mutant) or 70 nM (nonmutant). The subsequent hysterisis loop is approximately 10 times larger in the nonmutant case. Parameter values are α = 50, K1 = 0.05 nM−1, and K2 = 0.026 nM−1 for the mutant system, and K2 = 0.033 nM−1 for the nonmutant system (12, 13).

