Figure 2.
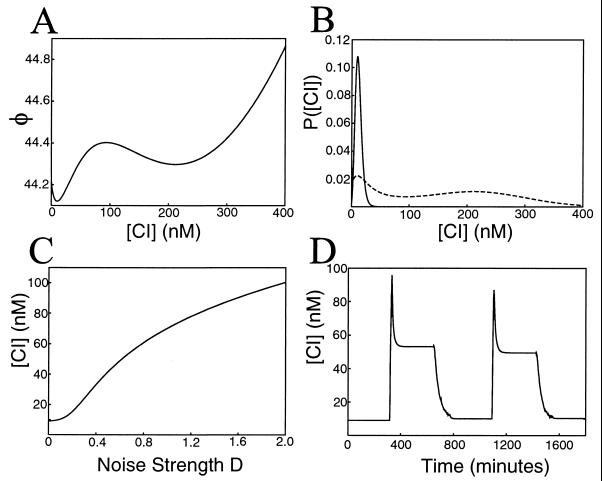
Results for additive noise with parameter values α = 10 and γ = 5.5. (A) The energy landscape. Stable equilibrium concentration values of Eq. 8 correspond to the valleys at [CI] = 10 and 200 nM, with an unstable value at [CI] = 99 nM. (B) Steady-state probability distributions for noise strengths of D = 0.04 (solid line) and D = 0.4 (dotted line). (C) The steady-state equilibrium protein concentration plotted vs. noise strength. The concentration increases as the noise causes the upper state of A to become increasingly populated. (D) Simulation of Eq. 9 demonstrating the utilization of external noise for protein switching. Initially, the concentration begins at a level of [CI] = 10 nM corresponding to a low noise value of D = 0.01. After 6 hr, a large 30-min noise pulse of strength D = 1.0 is used to drive the concentration to 58 nM. After this pulse, the noise is returned to its original value. At 11 hr, a smaller 90-min noise pulse of strength D = 0.04 is used to return the concentration to near its original value. The simulation technique is that of ref. 23.

