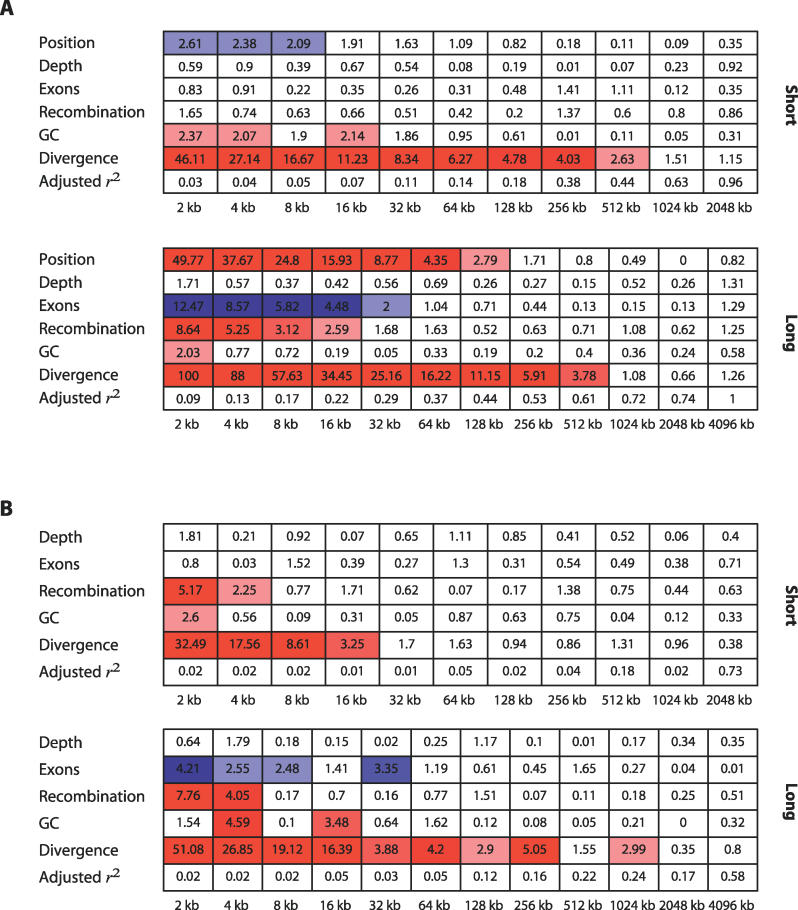
Figure 3. Marginal Significance (−log10 p-value as Determined by t-Test) of the Wavelet Coefficients from Four Annotations as Predictors of the Coefficients of the Decomposition of Ascertainment Panel Diversity.
Red boxes highlight significant positive linear relationships and blue negative. The intensity of the colour is proportional to the degree of significance.
(A) Smoothed coefficients.
(B) Detail coefficients.
Also shown is the adjusted r 2, which can be interpreted as the proportion of the variance in the signal explained by the linear model.

