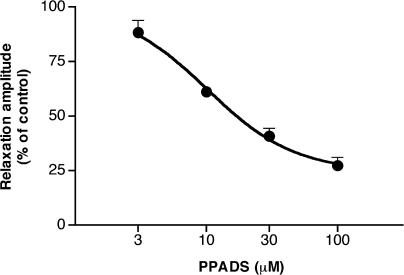
Figure 2.
Mean concentration–response curve for the inhibitory effect of PPADS (3–100 μM) on ATP (3 μM)-induced relaxations of U46619 (0.1 μM)-precontracted longitudinal muscle strips of the rat gastric fundus under NANC conditions. Relaxations were measured as peak amplitudes and expressed as percentages of the control in each strip. Each point represents the mean±s.e.m. of responses observed in four strips.

