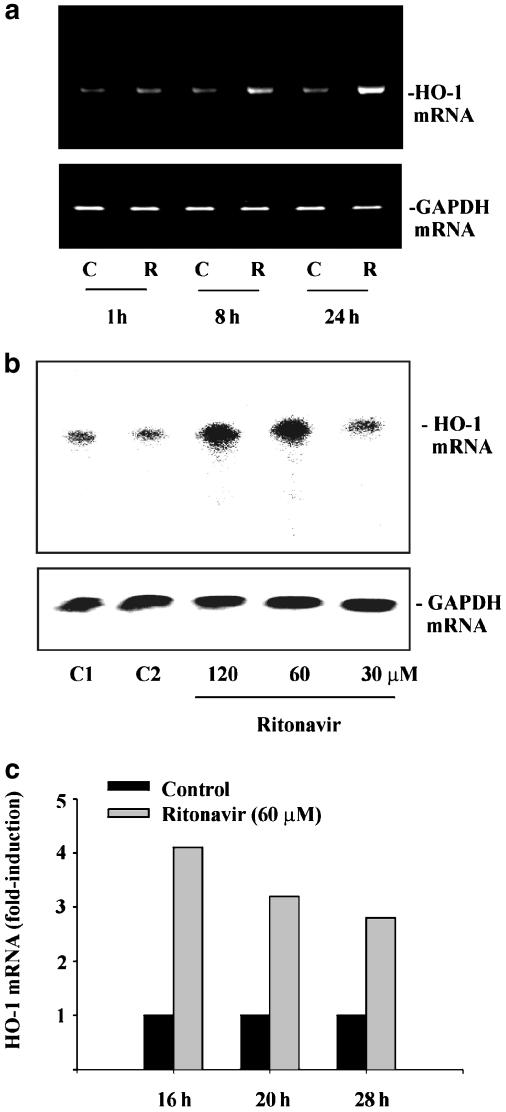
Figure 4.
Ritonavir induces HO-1 mRNA in DLD-1 cells. (a) DLD-1 cells were either kept as unstimulated control (C, 0.1% DMSO) or were stimulated with ritonavir at 60 μM (R). After the indicated time periods, cells were harvested, total RNA was isolated, and mRNA expression of HO-1 and GAPDH was determined by semiquantitative RT–PCR analysis. One representative of three independent experiments evaluating HO-1 expression by RT–PCR is shown. (b and c) Ritonavir-induced HO-1 mRNA induction was assessed by RNase protection assay. DLD-1 cells were stimulated in three independent experiments with the indicated concentrations of ritonavir for either 16, 20, or 28 h. One representative of these RNase protection assays is shown in (b); cells were stimulated for 20 h. (c) The degree of HO-1 mRNA induction by ritonavir (60 μM) relative to GAPDH mRNA was quantified by PhosphoImager (Fuji) analysis of the radiolabeled gels. C1 (0.1% DMSO) and C2 (0.2% DMSO) represent vehicle control for ritonavir at 60 and 120 μM, respectively.

