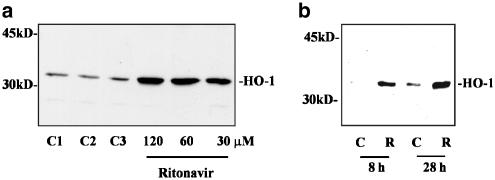
Figure 5.
Ritonavir induces expression of HO-1 protein. (a) Dose–response curve of ritonavir-induced HO-1 protein. DLD-1 cells were kept as unstimulated control or were stimulated for 16 h with the indicated concentrations of ritonavir. Thereafter, cells were harvested and homogenates were assayed for HO-1 protein expression by immunoblot analysis. C1 denotes medium alone; C2 (0.1% DMSO) and C3 (0.2% DMSO) represent vehicle control for ritonavir at 60 and 120 μM, respectively. One representative of four independently performed experiments is shown. (b) Kinetic analysis of ritonavir-induced HO-1 protein. DLD-1 cells were stimulated with ritonavir (R, 60 μM) for the indicated periods of time. Thereafter, cells were harvested and homogenates were assayed for HO-1 protein expression by immunoblot analysis. One representative of three independently performed kinetics is shown.

