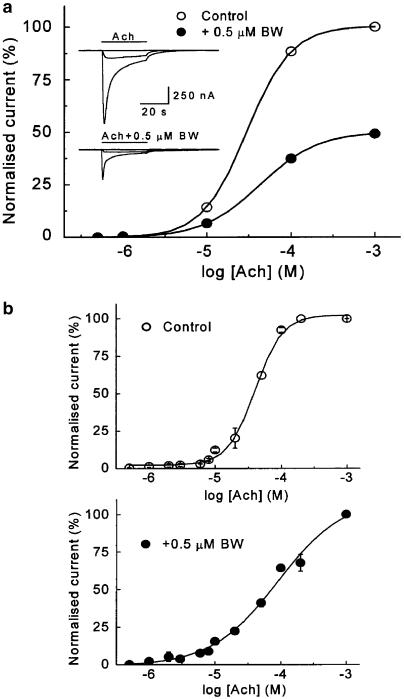
Figure 3.
Ach dose–IAch relationship for currents evoked by Ach alone or together with BW284c51 in oocytes bearing nicotinic AchRs. (a) The plot shows Ach dose–IAch relationships in an oocyte challenged with increasing Ach concentrations, applied alone or together with 0.5 μM BW284c51. Ach pulses were given for 32 s every 5–30 min, depending on concentrations, to ensure complete recovery between trials. The inset shows superimposed recordings obtained by applying to the same cell, at −60 mV, 0.5, 10 or 1000 μM Ach, either alone (upper records) or together with 0.5 μM BW284c51 (lower records). Note that in the presence of BW284c51, the values are roughly half of those obtained with Ach alone. (b) Graphs were obtained by averaging the IAch from seven oocytes (four donors) covering the total range of Ach concentrations tested. IAch was elicited by either Ach alone (upper graph) or coapplied with BW284c51 (lower graph). The dose–response curve for currents elicited by Ach alone best fitted to a two-site Hill equation, whereas in the presence of BW284c51, the best fit corresponded to a single-site equation.

