Figure 4.
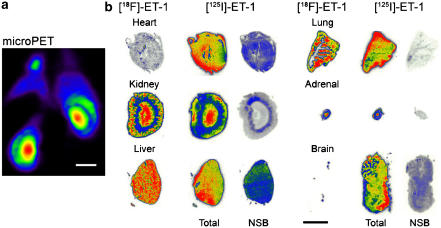
(a) [18F]-ET-1 microPET image showing delineation of substructures in rat kidney. (b) Distribution within ex vivo tissue sections visualised using phosphor imaging after in vivo administration of [18F]-ET-1 and in vitro incubation of the same tissue section with [125I]-ET-1. Nonspecific binding (NSB) was determined using an adjacent section. The kidney distribution in the microPET image is similar to that seen in the ex vivo section but at a lower resolution. Scale bars=10 mm.

