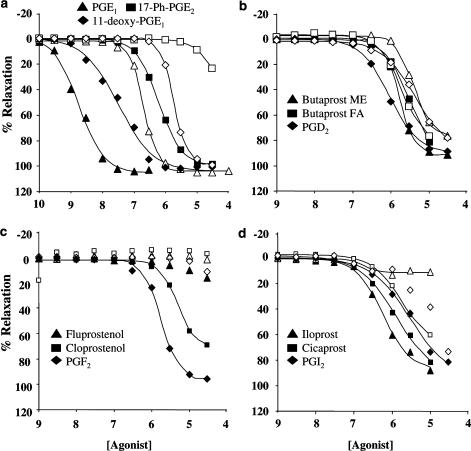
Figure 4.
Illustrative data showing agonist concentration effect curves in PSV in the absence (closed symbols) and presence (open symbols) of 10 μM GW627368X. Panel a: PGE1, 17-phenyl-ω-trinor PGE2, 11-deoxy PGE1. Panel b: Butaprost methyl ester, butaprost free acid, PGD2. Panel c: Fluprostenol, cloprostenol, PGF2α. Panel d: Iloprost, cicaprost, PGI2.

