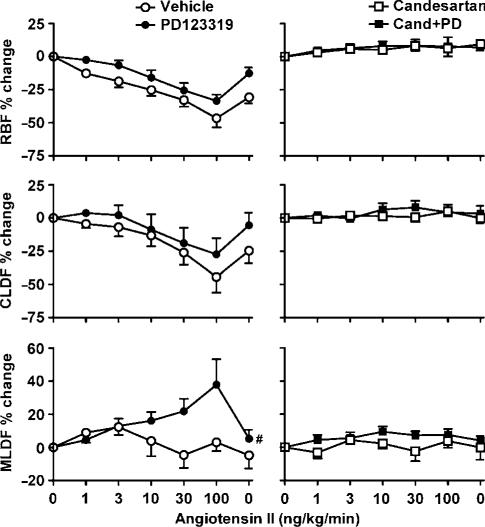
Figure 4.
Responses of sham rats to renal arterial infusion of Ang II (1, 3, 10, 30 and 100 ng kg−1 min−1, followed by a recovery period). Data indicate percentage changes, during the final 10 min of each 15 min infusion, compared with baseline levels before Ang II infusion. Lines and error bars represent mean±s.e.m. (n=6). Abbreviations are the same as for Figure 2. #P⩽0.05 for main effect of PD123319 treatment from analysis of variance.

