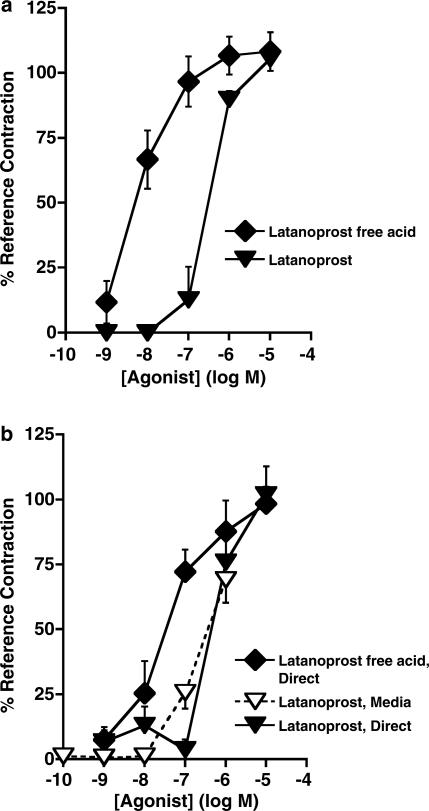
Figure 6.
Concentration–response curves for (a) latanoprost free acid and latanoprost in rabbit isolated uterus, (b) latanoprost free acid or latanoprost in the mouse isolated uterus (designated as Direct), compared to those of latanoprost and any potential active metabolites transferred from rabbit uterus media to the recipient mouse isolated uterus bioassay, graphed as final concentrations following 1 : 10 dilution (designated as Media). Results are expressed as mean±s.e.m. of five to six experiments.

